County Feeding Application
Role: Creative Direction, UI/UX Design
Team: krumware & Earth Technology Integration
Customer: State of South Carolina Emergency Management Division
Timeframe: March-April 2020
Synopsis/Abstract
South Carolina needed a way to track number of meals fed to citizens across the state at the onset of the COVID-19 pandemic in order to identify areas or demographics that were underserved in feeding capacities. We identified the core needs, developed a rapid solution to generate feedback, and within a month logged millions of meals. This vital data helped inform stakeholders at the state level to make educated decisions to support specific areas and demographics that were underserved and needed desperately at this time.
Background
The COVID-19 pandemic hit South Carolina with severity on March 13 when Governor McMaster declared a State of Emergency. Schools and then all non-essential businesses (March 31) closed within weeks, leaving citizens in underserved locations and demographics with immense struggles finding food. South Carolina Emergency Management Division ESF-6 worked with various agencies and school systems to identify methods and mechanisms to serve these areas. School districts shifted from education hubs to feeding centers. Non-profits and agencies went into hyper-speed in order to help the drastically growing numbers of citizens that needed meals. Before the pandemic, schools were previously serving free and reduced (proper terminology?) breakfasts and lunches for students. Now they were feeding every meal to these students and their families in order to support their surrounding communities in a time of dire need. SCEMD’s ESF-6 was critical in helping facilitate these efforts with funds and materials across the state. However, as everyone immediately became overwhelmed with needs, it was difficult to identify which areas and demographics needed help.
Problem
Research
I was initially notified of the needs in our weekly sprint overview, about a week before non-essential businesses were ordered to close. At this time I didn’t know what depth the pandemic would take us to; however, I was informed of the essential need to get a solution developed for ESF-6 to solve their problems. I knew that we didn’t have the time for full user research involving stakeholder interviews with ESF-6 staff, school district/agency employees, or staff on feeding lines that I might go through in this process. Not to mention, the krumware team had moved to working fully remote as a result of the pandemic and didn’t want technical or logistic issues to get in the way of this changing landscape.
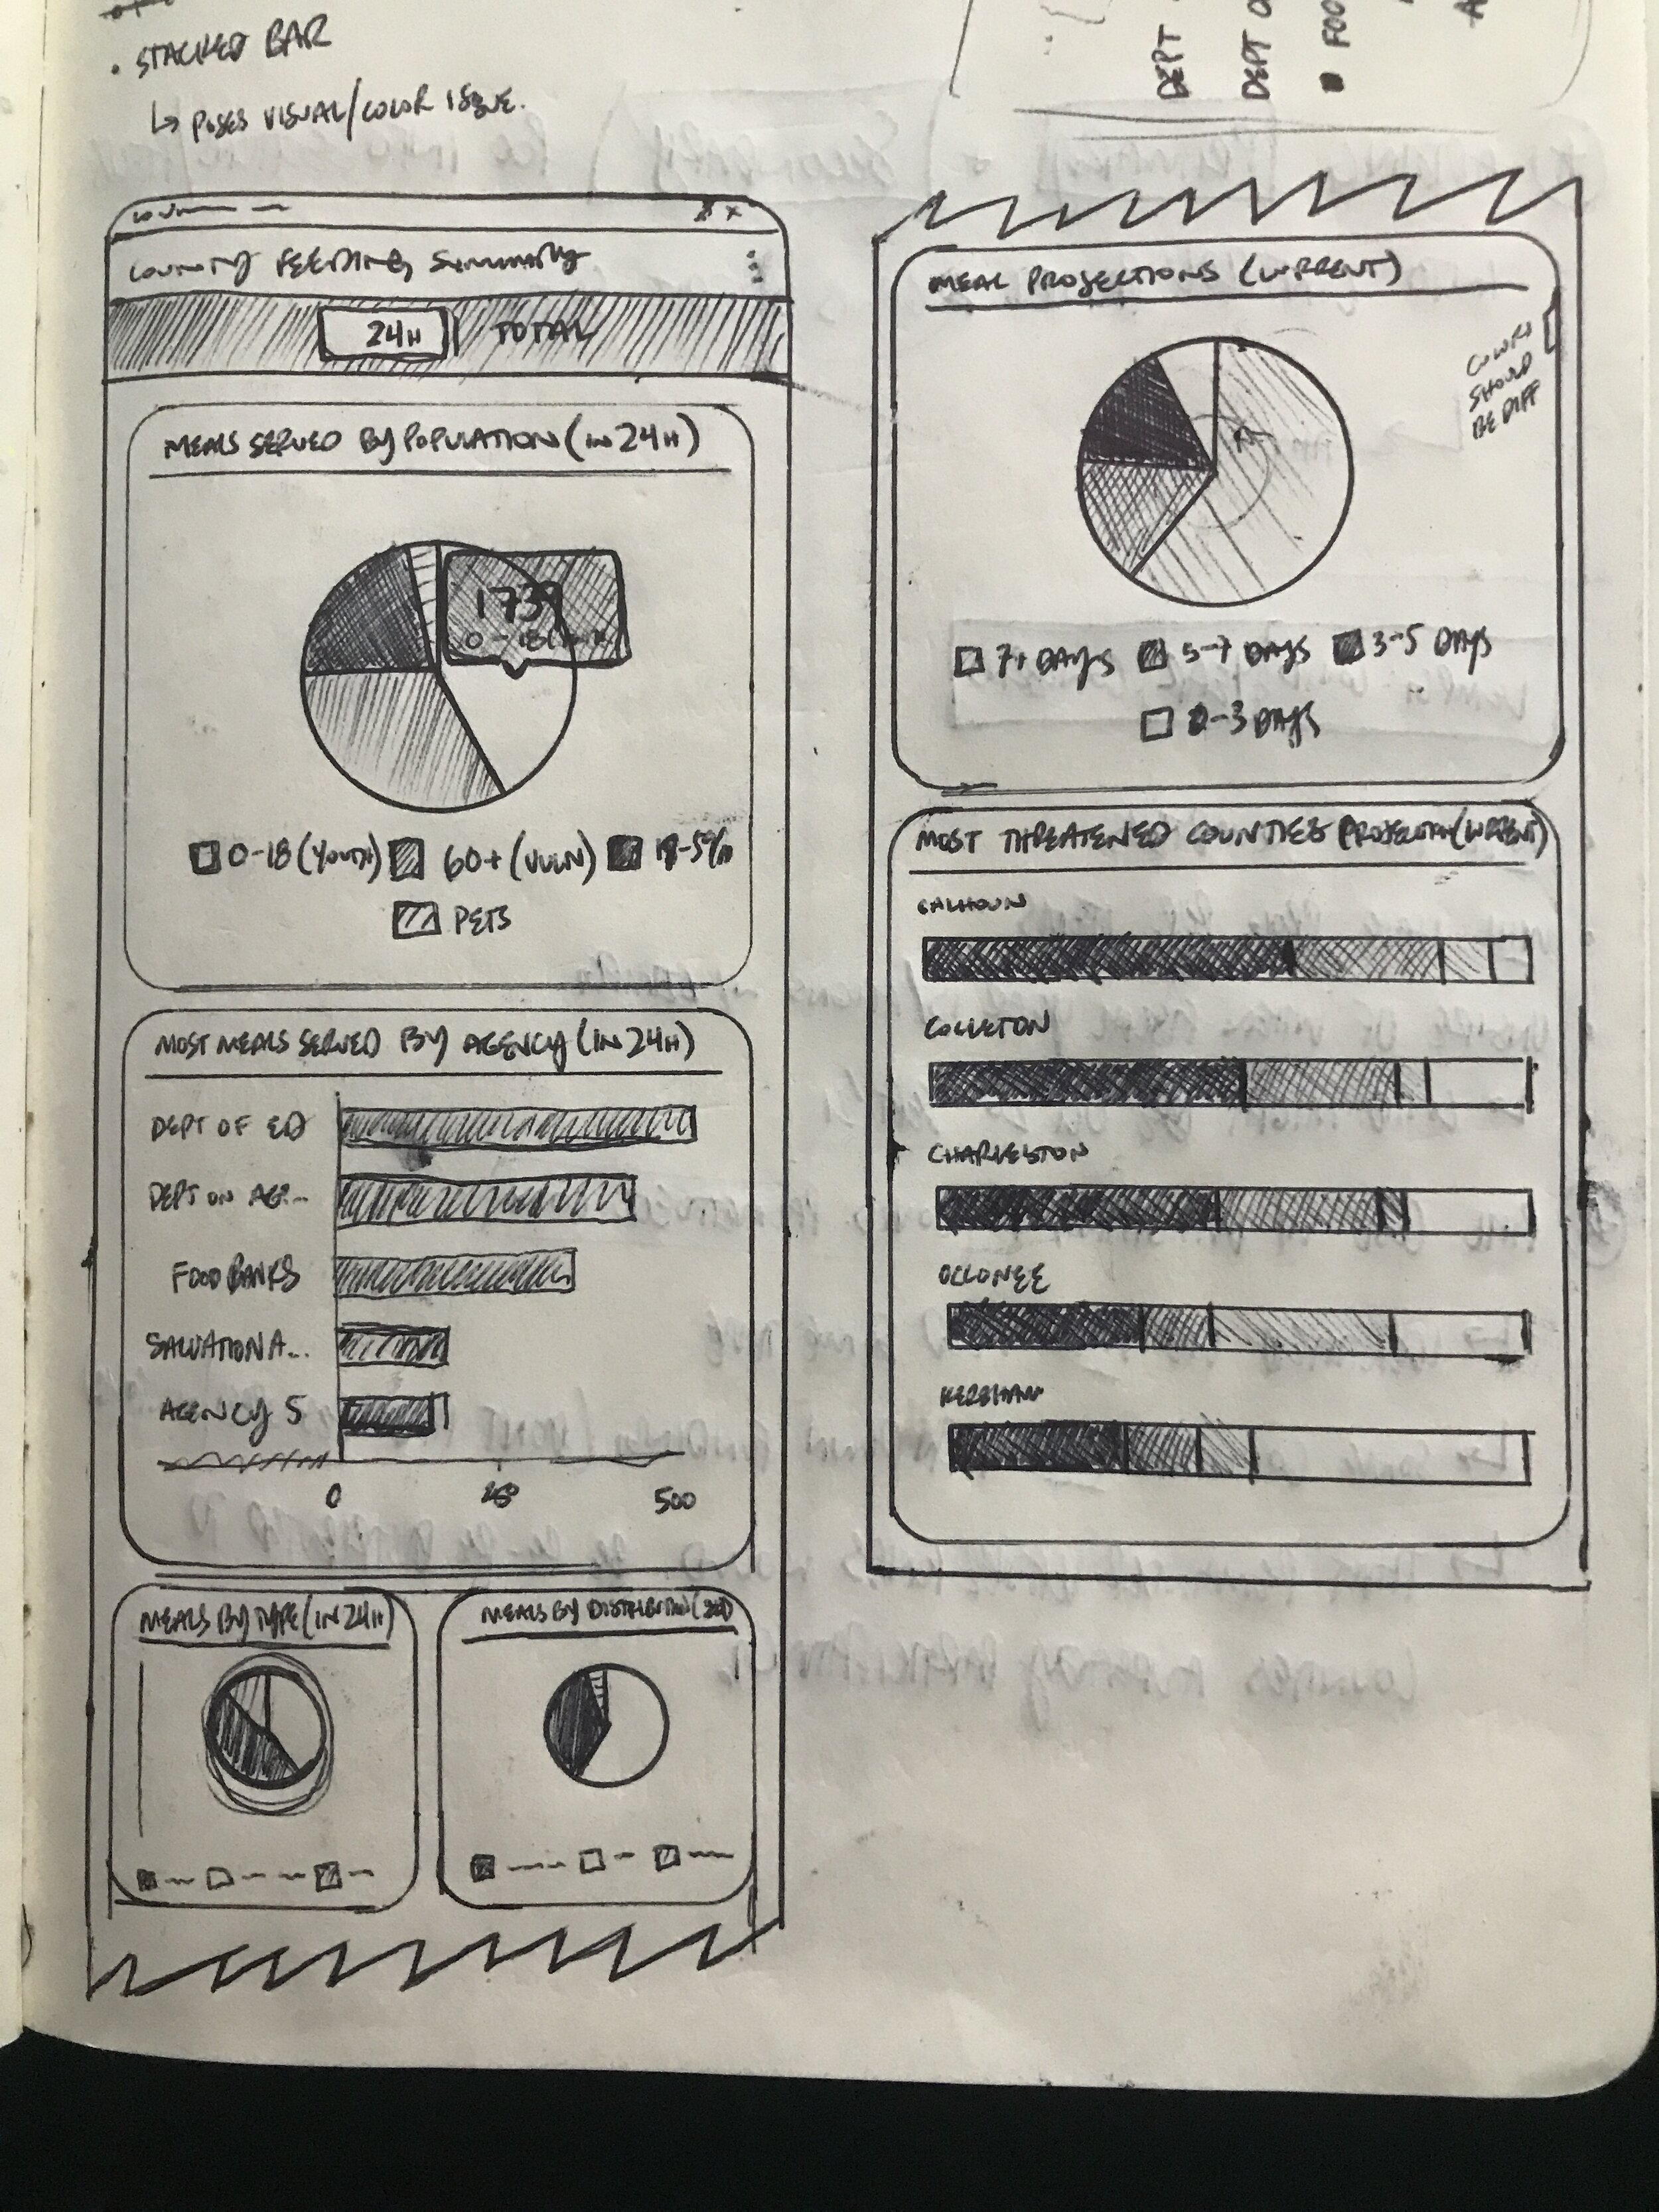
We had to prioritize designing and building a functional MVP based on what information we could gather. I identified and leveraged what we did have access to: Phil A, our Product Owner, and Rob B, head of ESF-6 at SCEMD. Rob B was working around the clock to keep counties supplied and therefore unable to give us much lengthy feedback. He did sit down with his team to draft an initial idea of what we needed to capture from their perspective (See Fig. 1). After review of this document and thorough discussions and questioning with Phil A, I had enough information to define initial goals and scope of work for this MVP which we could test and validate. We defined that “success” would be ~100k meals tracked & 12 of 46 counties participation (roughly 25%) within 60 days. This data would be a large enough, yet diverse enough sample size to provide insightful data to our state stakeholders where informed decisions could be made regarding support for feeding capabilities.

Rob B, head of ESF-6 at SCEMD, was working around the clock to keep counties supplied and unable to give us much lengthy feedback. He did sit down with his team to draft an initial idea of what we needed to capture from their perspective. This provided a great starting point from a validated stakeholder.
Was I positive on this direction?
Not absolutely, in fact we still had a number of questions that needed answers based on Rob’s initial drawing above; however, with their rapid response, we had to do the best to fill gaps and develop a working solution in this time frame. In this instance, we weren’t sure of the exact decisions that needed to be made for our end users; however, what we were doing would reduce the strain and problems that ESF-6 faced currently. We anticipated working on further sprints to enhance this product based on feedback we hoped to gain. We had previously formed a strong working relationship with stakeholders in SCEMD’s ESF-6 while building their Mass Feeding Application and knew they had a strong understanding of our iterative, lean process. This was critical in moving swiftly.
After our discussion, I was able to identify key stakeholders (even if we had trouble reaching them at this time):
State (SCEMD) users
County users
Agency users (whom updated their meal count numbers when locations reported to them)
Feeding location staff (at this point, we weren’t 100% positive at this point who was reporting meal count & projections, but had heard Feeding staff were reporting to their agency managers for input in system)
While functionality like detailed executive summaries and reports were desired by many stakeholders, they were not essential to the immediate problem and could be added later.
We defined that “success” would be ~100k meals tracked & 12 of 46 counties participation (roughly 25%) within 60 days.

Explorations
Once primary questions like stakeholders and scope were defined, I started to define details of the interface itself. I jotted a list of “What data is available in county feeding?” to utilize. This included metrics like:
Meals by (County) by day
County meals by agency (Daily & Total)
% of meals served by demographic across County & state.
Identification of these data points allowed me to focus initially on what values were actually at my disposal to represent and not design something we didn’t have the information for. I shared my list and findings to Rudra, our project Application Engineer, and began informing him of the overall details, scope, and my initial “data points”. I took Rudra’s feedback and critiques into consideration and began the wireframing process (late Tuesday).
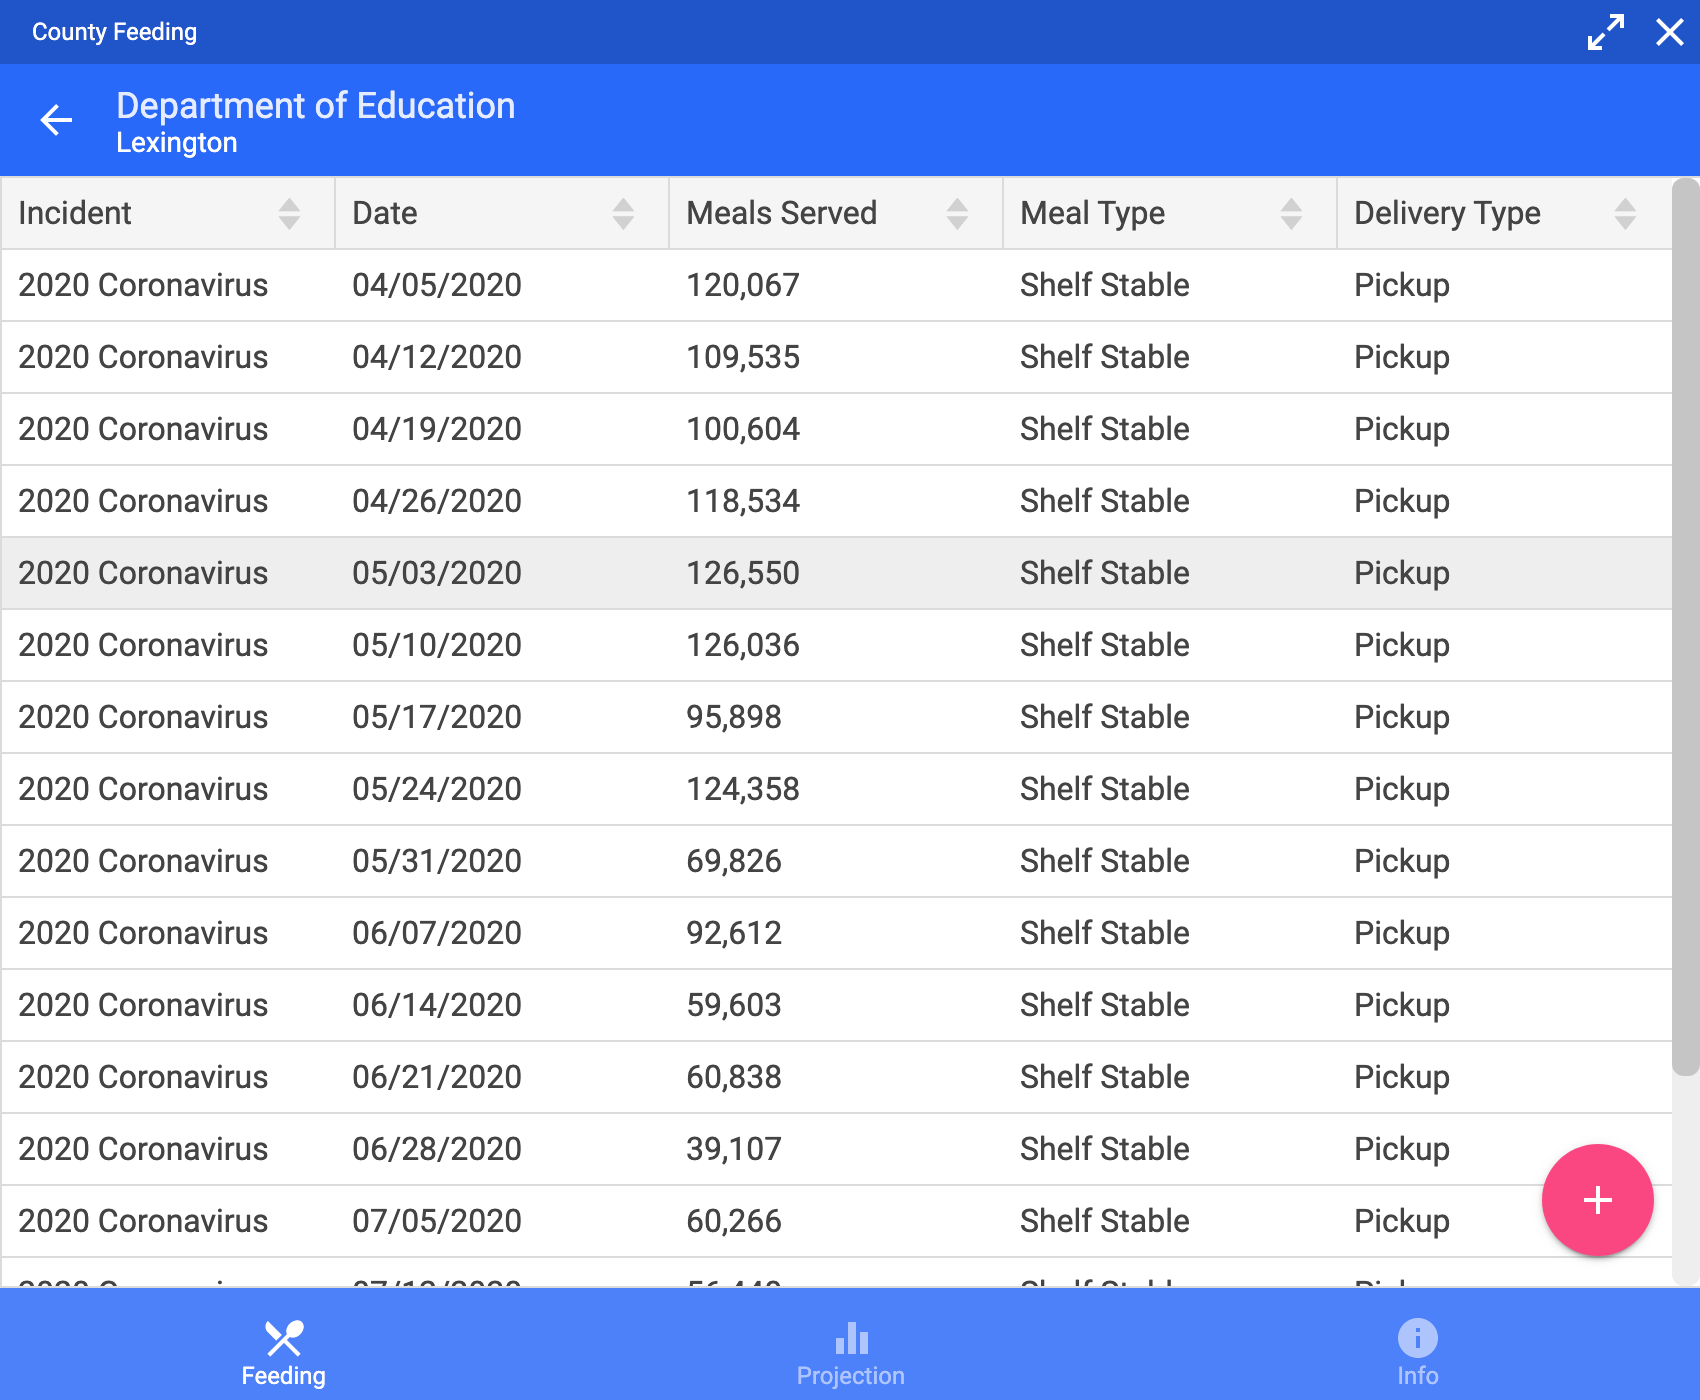
One major question I ran into while drawing thumbnails, was how county and agency users would select between the meals served section and the projection sections. These different levels of input (meal counts as infinite integer entries over a number of demographics vs. a projection selection from a dropdown) posed difficulty viewing properly, while including all specifications or business needs. (See Fig. 3 Sketchbook). Fortunately, we had designed and developed table UI and structures for viewing, filtering, and sorting table data and viewing drill-down relationships (Counties within state, Agencies within a given county) within this product. Leveraging UI some users were familiar with created a more familiar experience, but made incorporating these new relationships challenging as well. After discussing direction with Phil, Rudra, and Rob, I received approval to move forward. I finished design, worked with Rudra over some specifications on development, and by the end of the week we had a fully functional MVP ready to validate.


Validation
On Monday, Rob was able to demo the MVP to his team and other stakeholders at a meeting and received praise for the product which was only a napkin sketch days ago. There were a number of further questions (many about features that were carefully excluded in the MVP to make the deadline) and we made note of them in according GitHub issues with reasoning. Rob and his team of stakeholders unanimously approved the initial product rollout to our production environment in order to get it in the hands of county and agency users and get their feedback. At this point, we rolled through another round of QA for polish and released updates quickly after our initial rollout, then awaited feedback from the community.
Three weeks later, we received feedback from Rob and the ESF-6 team with request to update the executive summary with an enhanced version we had promised at a later point. They also provided feedback on their feeding workflow process, which was influential to the workflow of this application. Ultimately, the daily updates for Feeding Staff was slowing their workflow down and needed to work around this. We didn’t know if these users even had access previously, but this quick rollout not only answered that question, but identified how and what was problematic to their process. We suggested a weekly workflow where they updated their projections weekly instead of daily. This allowed users to keep track of projections (and meal counts) without slowing down their processes, while also keeping the state informed of the meal counts fed and needs across counties with their updated executive summary. Rob and the ESF-6 team have been using the system heavily since rollout.
Outcome/Success
After the second pass of design and adapting to our users’ needs, we were able to roll out the MVP within a week and a robust application solving follow-up workflow concerns within a month. When this application rolled out, the COVID-19 response was still very much a priority. Our next steps would include to holding a remote focus group with all stakeholders represented or begin some usability testing when circumstances improve.
First week after initial release, 650 thousand meals were logged across 19 counties and 4 agencies.
One month after initial release, 7.8 million meals were tracked
Three months after initial release, over 35 million meals were served and tracked within our system across the State of South Carolina during the COVID-19 pandemic.
We initially defined that ~100k meals with 25% of counties across the state participating (within 60 days) would be a major success. Not only did we surpass our goals, but did so within the first week of launch. We had no idea this application would get the rapid usage that it did. Not only that, but within weeks Governor McMaster was briefing meal feeding capacities of the state from our application Executive Summary in statewide and national-level briefings to Governors.
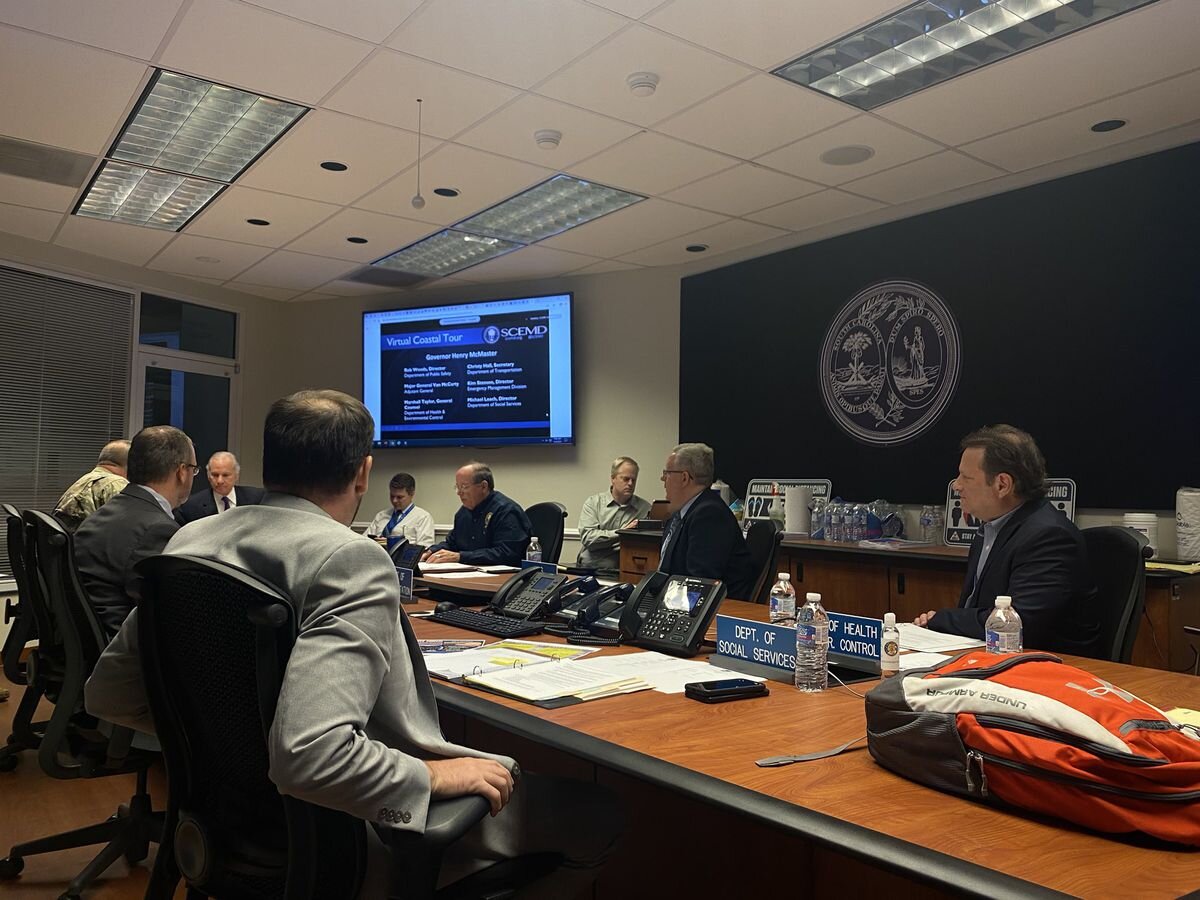
Governor’s Conference Room where State & National briefings occur from SCEMD’s State Emergency Operations Center.
[Photo from pre-pandemic onset]
Photo: WISTV
Contributions/Acknowledgements
Phil A and Rob Z of ETI
Rudra G at krumware
Steven B, Melissa P, Guy G, and Rob B at SCEMD
All medical, first responders, and those on the front lines serving meals/providing basic needs.